You can embed notebook outputs across your MyST documentation. To do so, first attach a label to a notebook cell’s output, and then use the Embedding syntax for cross-references to embed it elsewhere. By linking directly to the notebook you can improve the reproducibility of your technical work.

Figure 1:A scientific article with two figures created in Jupyter Notebooks. Each figure can be labeled directly in the notebook and reused in any other page directly.
Label a Notebook Cell
You can label notebook cells in two ways:
Use cell metadata comment syntax at the top of the cell. Use a comment, followed by the pipe (|) operator at the top of a cell to set cell metadata.
For example, the following comment in a Python cell sets a label[1]:
1 2 3 4 5#| label: mycelllabel # The comment above has special syntax and sets cell metadata. # This allows us to embed "Hello world!" in other places. print("Hello world!")
Note that # is the comment symbol for Python, but you’d use whatever symbol is used in the language for the notebook.
Add the label directly to the cell metadata. Use a Jupyter interface or text editor to embed the label in the cell’s metadata. For example, here’s sample JSON that shows what metadata should look like:
1 2 3 4 5 6{ "trusted": true, "editable": true, "tags": [], "label": "my-other-cell-label" }
Cross Reference a Cell
Any labeled Jupyter cell can be referred to using the standard cross-reference syntax of markdown links.
[](#my-cell) - This is a cross-reference to a notebook cellThe cross-referenced cell will be shown in a hover-preview and link to the notebook cell directly. For example, here we cross-reference a cell from the Jupyter Notebooks examples
Embed a cell output
Once a cell is labeled, you can embed its output with the standard syntax for embedding content with MyST. For example, the following code embeds a labeled cell defined in Interactive Notebooks with MyST:
It results in the following:
Embed the entire cell with the {embed} directive
If you use the MyST short-hand for embedding ( syntax), then only the cell outputs will be embedded.
If you’d like more control over the display of inputs and outputs, use the embed directive.
For example, to embed both the cell input and output, use syntax like:
% Embed both the input and output
```{embed} #tbl:data-cars
:remove-output: false
:remove-input: false
```# Take a subset of cars so it displays nicely
data.cars().iloc[:5, :5]Outputs as Figures
The labeled output can also be used in the {figure} directive, where you can then add a caption.
Below we give the figure a new name as well, so that we can cross-reference it directly.
:::{figure} #my-cell
:label: fig-my-cell
:::By default, the figure removes the code, to keep the code you can add :remove-input: false to your directive.
Placeholder Content
It is possible that the Jupyter output may not work without computation, or you want to have a different figure in your static outputs. This is common if you are using interactive widgets, which only work when there is an active Jupyter kernel attached to the page. To create a placeholder image, add the option in the directive.
:::{figure} #my-cell
:placeholder: ./image/static.png
:::
The placeholder will be used in static exports when the output cannot be directly serialized.
You may also define a placeholder image directly in a Jupyter notebook cell, in the same way you may label the cell:
#| label: my-cell
#| placeholder: hello.png
print('hello world')
In this case, the placeholder will replace any output from the cell in static exports; outputs will only show up in interactive environments.
Alternative text for accessibility
Adding alternative text to images allows you to provide context for the image for readers with assistive technologies, or unreliable internet connections.
By default, Jupyter does not support alternative text for image outputs, but you can use MyST to add alternative text with the {figure} directive.
See Images, Figures and Videos for more details.
Using the {figure} directive allows you to set one or more captions for your figures, which serve accessibility purposes as well.
This works for both static outputs (like Matplotlib) as well as interactive ones (like Altair).
For example, the following {figure} directive embeds two cell outputs with captions:
```{figure}


```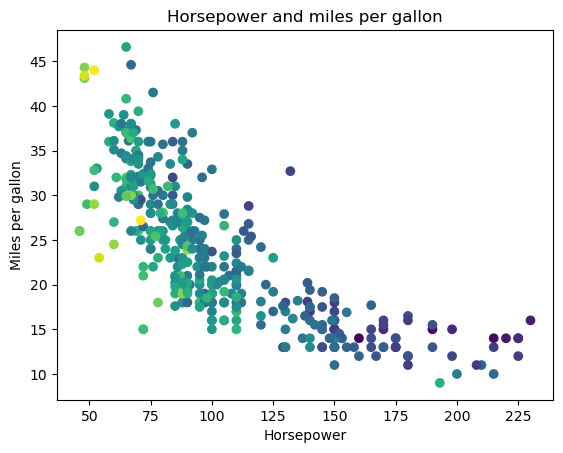
A matplotlib image of the cars data
An Altair visualization of the cars data!
Outputs as Tables
You can wrap tabular outputs (e.g. Pandas DataFrames) with a {table} directive in order to assign a caption and include it with your figures.
There are two ways to do this:
The {table} directive
You can use a {table} directive and embed the notebook output inside the directive body.
For example:
:::{table} This is my table
:label: mytable

:::Results in:
Table 1:This is my table
Use the {figure} directive with kind: table
This defines a figure but allows the content to be a table. For example, the following syntax:
:::{figure} #tbl:data-cars
:label: myothertable
:kind: table
This is my table caption!
:::
Results in:
Table 2:This is my table caption!
In either case, you can now reference the new table directly.